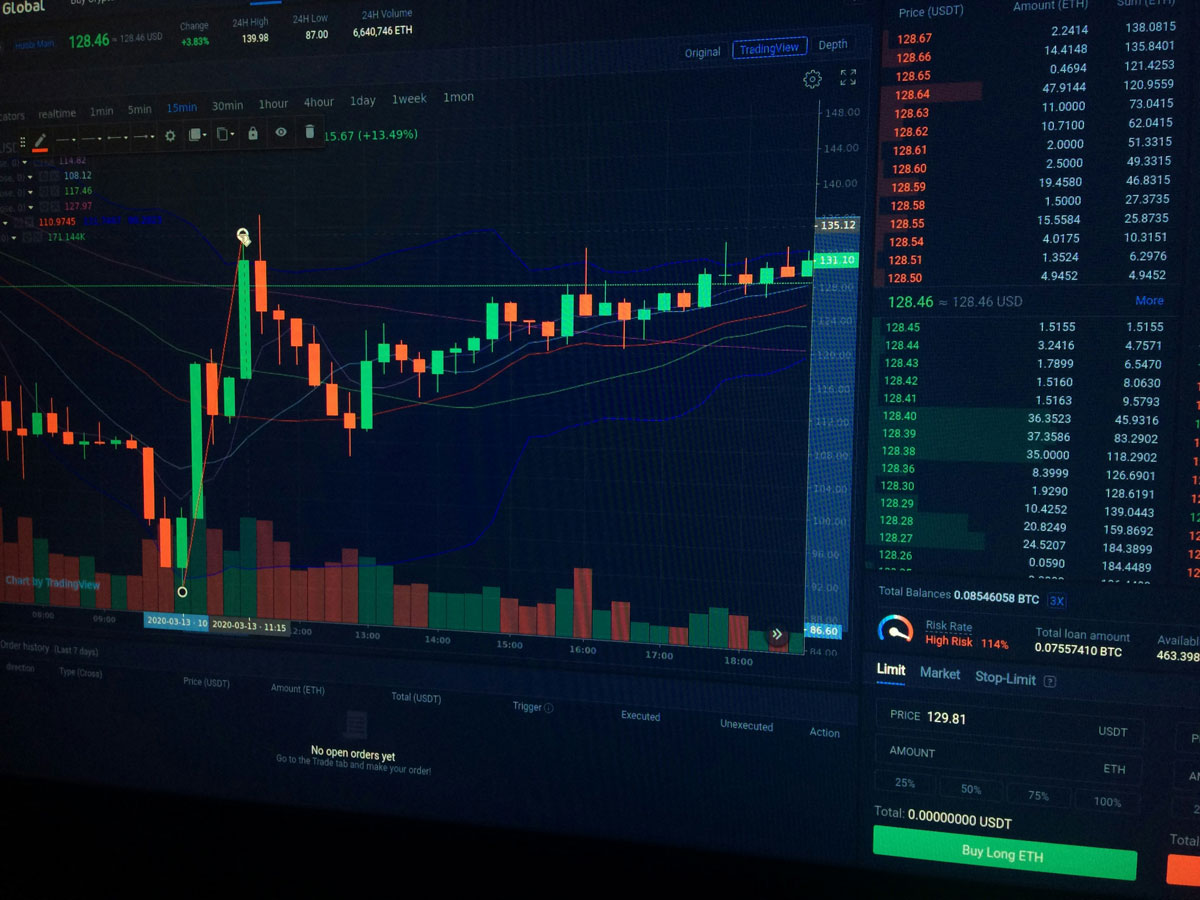
 Photo by Vladislav Maslow on Unsplash
Your roommate just dropped fifty bucks into some ticker they saw on TikTok. You want in too, but you have no idea if that stock is about to rocket or crash by Friday.
A stock chart shows you the story of a stock's price. It doesn't care about a headline or a hot take from a stranger online. A stock chart shows you what actually happened, plotted out in front of you.
Here are the things to know before you ever trade stocks as a college student.
A stock chart plots price on one side and time on the other. Every wiggle on that line represents real money moving in or out of a company. Zoom out, and you see months of behavior. Zoom in, and you see a single trading day, sometimes down to the minute.
Candlestick charts pack in even more detail. Each candle shows the open, close, high, and low over a given period. Green usually means the price closed higher than it opened. Red means it closed lower. Line charts strip all that away and just track the closing price, which works fine if you only care about the big picture trend.
Once you know what you're looking at, a chart stops looking like random static. It starts looking like a timeline you can actually read, the same way a heart monitor tells a nurse something a symptom alone never could.
Econ 101 covers supply curves and GDP. It rarely touches how to read a candlestick or spot a trend line. This explains why so many college investors learn the hard way, usually after losing money on a stock they picked because a friend mentioned it in a group chat.
Reading charts is a separate skill from understanding markets in theory. You can ace a finance exam and still buy a stock at its peak because you never checked the chart first.
Theory tells you why a market moves. A chart tells you when it already has.
Before you buy a stock, look at the following:
Trend: Look at where the price has been heading over the past few weeks. An uptrend means buyers keep showing up. A downtrend means sellers do. Sideways movement means the stock is stuck, waiting for news to push it one direction or the other.
Support and Resistance: Support is the price floor a stock keeps bouncing off of. Resistance is the ceiling it struggles to break through. Watch a stock test resistance three or four times. Once it finally breaks above that line, momentum often follows, and the old ceiling frequently turns into the new floor.
Volume: Volume sits at the bottom of most charts as a bar graph. High volume during a price jump suggests many people believe in the move. Low volume means the jump might not stick around. A stock that pops 10% on almost no trading is a lot shakier than one that pops 10% with millions of shares changing hands.
The same stock can look completely different depending on the window you pick. A one-day chart might show a stock crashing 8%. Zoom out to a one-year chart, and that same stock might still be up 60%. New investors panic on the daily view all the time without ever checking the bigger frame.
Pick your timeframe based on your plan. Day traders live on five-minute and hourly charts. Someone holding for a year barely needs to glance at anything shorter than a weekly chart.
Imagine a stock pushing above resistance, everyone piling in, and then dropping right back below that line within a day. That's a fake breakout, and it constantly catches new traders. The chart looked like a green light, but it wasn't.
Always wait for the close. A stock that breaks resistance and holds above it by the end of the trading day is far more trustworthy than one that pokes above it for twenty minutes during lunch.
Patience here saves you from chasing a move that's already over by the time you click buy.
Most trading apps let you pull up a chart with one tap. Start there. Pick a stock you already know, maybe Apple or Nike, and watch its chart for a week without spending a dime. Notice how the price reacts around earnings dates or a viral product launch.
Paper trading accounts work even better. TD Ameritrade's thinkorswim platform has one built in, and it costs nothing to open. You place fake trades, track the outcome, and build pattern recognition without risking your textbook money.
If you want a deeper walk-through of chart types and the patterns traders actually watch for, you can learn to read stock charts step by step instead of guessing your way through it.
Buying a stock because it's trending on Reddit or StockTwits without glancing at the chart first is the fastest way to burn through your first hundred dollars.
The stock might already be up 40% for the week by the time it hits your feed. Buy then, and you're not catching a wave. You're buying the top from someone else who got in early and is ready to sell.
So, check the chart before you check the hype.
Tickers come and go. Next semester, something else will trend, and another ticker will replace it after finals. The chart reading skill sticks around no matter which stock your group chat is obsessing over next.
Learn to read stock charts, and you stop reacting to noise and trends. You start reading the actual price action, which is the only thing that ever really tells you what a stock is doing.


Discover our other works at the following sites:
Danetsoft is a global web agency headquartered in Indonesia, specializing in web development, managed hosting, and web publishing platform.


 [email protected]
 Magelang, Central Java
 © 2026 Danetsoft. Powered by HTMLy