Modern IT environments produce large amounts of operational noise. Logs flood in from cloud workloads, metrics spike without warning and application traces stretch across dozens of interconnected services. Finding the actual source of a problem often takes far longer than detecting the problem itself.
It’s important to know how Elastic Observability Services use Elasticsearch for security and operations teams. Elasticsearch sits at the centre of elastic observability services. It helps organisations search and analyse raw data at scale. Instead of reviewing scattered alerts across separate tools, teams get a clearer operational picture from a unified data layer.
The value is more practical than theoretical. Faster root cause analysis reduces downtime, limits operational disruption and improves incident response efficiency across modern infrastructure environments.
Infrastructure has changed faster than many monitoring strategies.
Traditional applications once lived inside predictable server environments. Failures were easier to isolate because dependencies were limited. Modern environments behave differently. A single transaction may involve:
When performance degrades, the issue doesn’t sit in one obvious location. A failed service may trigger secondary failures elsewhere. CPU spikes could result from network latency rather than compute exhaustion. Authentication failures might actually trace back to overloaded backend systems.
Without telemetry correlation, teams spend valuable time investigating symptoms instead of causes.
This is precisely where how elastic observability services use Elasticsearch becomes operationally important.
Elastic Observability Services depend on Elasticsearch to ingest, store and query telemetry data in near real time. Logs, metrics, traces, and events are indexed into a searchable environment where relationships between systems become easier to detect.
The strength of Elasticsearch comes from its distributed architecture. It can process large data volumes without slowing investigations down significantly. The platform handles three operational requirements particularly well:
| Capability | Operational Benefit |
|---|---|
| Distributed indexing | Supports large-scale telemetry ingestion |
| Fast querying | Speeds up investigations during incidents |
| Data correlation | Connects logs, traces, metrics, and events |
This combination allows teams to investigate infrastructure behaviour from a single operational context instead of moving between fragmented monitoring systems.
That distinction matters more during live incidents than during normal operations.
The clearest example of how elastic observability services use Elasticsearch appears during high-pressure outage investigations.
Consider an e-commerce platform experiencing intermittent checkout failures.
At first glance, the issue may appear application-related. Customer transactions slow down, response times increase and APIs begin timing out. Traditional monitoring tools may trigger alerts across several systems simultaneously, creating confusion rather than clarity.
Elastic Observability Services allow engineers to correlate:
inside one investigative workflow.
A failed transaction can be linked directly to a database bottleneck or container memory issue without manually stitching evidence together from multiple dashboards. This reduces investigative delay significantly. The operational advantage is not simply visibility. It is a searchable context.
Understanding the investigation sequence helps explain why Elasticsearch improves diagnosis speed.
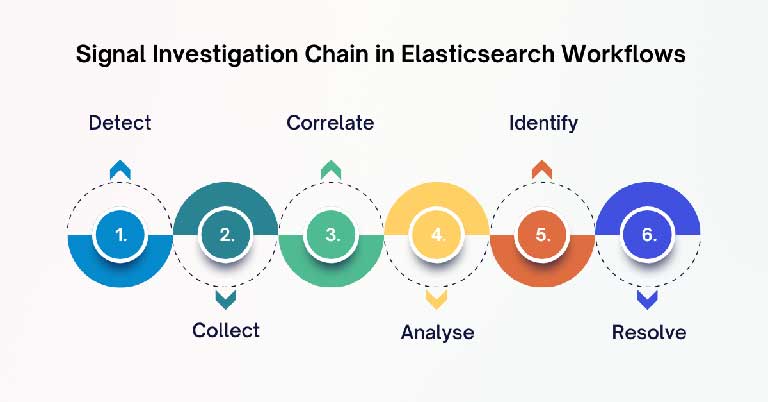
The process sounds straightforward on paper. In practice, most operational delays happen between the correlation and identification stages. Elasticsearch shortens that gap considerably.
Modern environments depend heavily on microservices and distributed architectures. A single user request may pass through multiple systems before completion. For organizations managing AI-powered services, specialized infrastructure like an AI Gateway can provide intelligent routing and monitoring for LLM API calls alongside traditional service observability.
When one component slows down, downstream services often suffer first. This creates misleading symptoms.
Elastic Observability Services use Elasticsearch to store distributed tracing data alongside operational telemetry. Teams can reconstruct transaction paths across applications and infrastructure instead of analysing isolated systems separately. This becomes even more useful during intermittent failures where symptoms appear inconsistent.
For example, a payment service slowdown may actually originate from delayed responses inside a backend inventory database. Without tracing visibility, teams often investigate the wrong layer first.
Elasticsearch improves trace searchability and dependency mapping at scale, which helps reduce those investigative mistakes.
There is now a major overlap between observability and cybersecurity operations. Security incidents increasingly appear first as operational anomalies rather than explicit security alerts.
Examples include:
| Behaviour | Possible Risk |
|---|---|
| Sudden outbound traffic spikes | Data exfiltration |
| Abnormal process execution | Endpoint compromise |
| Authentication anomalies | Credential misuse |
| Resource consumption surges | Cryptomining activity |
This overlap explains another aspect of how elastic observability services use Elasticsearch.
Security telemetry and operational telemetry can exist within the same searchable environment. Analysts no longer need to pivot manually between disconnected systems to understand what happened. That improves both investigation speed and evidence correlation.
A suspicious workload event can immediately connect to related infrastructure logs, network behaviour, and application traces. The workflow becomes less fragmented under pressure.
Static monitoring thresholds are becoming less useful in cloud-native environments. Infrastructure scales dynamically and normal behaviour changes throughout the day.
Elastic Observability Services support behavioural analysis using machine learning models built around Elasticsearch telemetry.
These models help identify:
The system learns baseline operational behaviour over time and flags deviations earlier than manual monitoring approaches typically can. This does not replace human investigation. It improves investigative starting points.
Receiving an alert with behavioural context attached is far more useful than receiving an isolated threshold notification with no surrounding operational evidence.
Despite the strengths behind how elastic observability services use Elasticsearch, implementation quality still determines long-term effectiveness. Several common issues continue to affect observability maturity.
Observability platforms still require governance, operational discipline and careful architecture planning. Technology alone does not solve investigative inefficiency.
Elasticsearch continues to remain central to many observability deployments because of its flexibility and scalability.
It supports:
More importantly, it allows organisations to correlate operational behaviour instead of analysing isolated system outputs.
This is the broader shift happening across modern infrastructure management. Monitoring, observability and security operations are gradually converging into unified operational workflows.
Elasticsearch aligns naturally with that direction because search and correlation sit at the centre of all three disciplines.
Modern infrastructure failures rarely present clean technical symptoms. Cloud workloads, distributed services and interconnected applications create operational complexity that traditional monitoring approaches struggle to interpret quickly.
This explains the growing importance of how elastic observability services use Elasticsearch in modern operations environments. Elasticsearch helps organisations search and analyse telemetry data across systems fast enough to support practical root cause analysis during live incidents. The result is improved visibility, reduced downtime, faster investigations, and stronger operational resilience.
For organisations managing complex hybrid or cloud-native environments, observability strategy matters just as much as tooling selection. Telemetry architecture, data correlation, and search optimisation all affect investigation quality.
CyberNX can help organisations build observability driven security operations that support continuous monitoring, rapid detection and operational confidence. Their full stack observability solutions provide expert analysis so your teams can respond to threats and outages with greater clarity and speed.
Discover our other works at the following sites:
Danetsoft is a global web agency headquartered in Indonesia, specializing in web development, managed hosting, and web publishing platform.
© 2026 Danetsoft. Powered by HTMLy